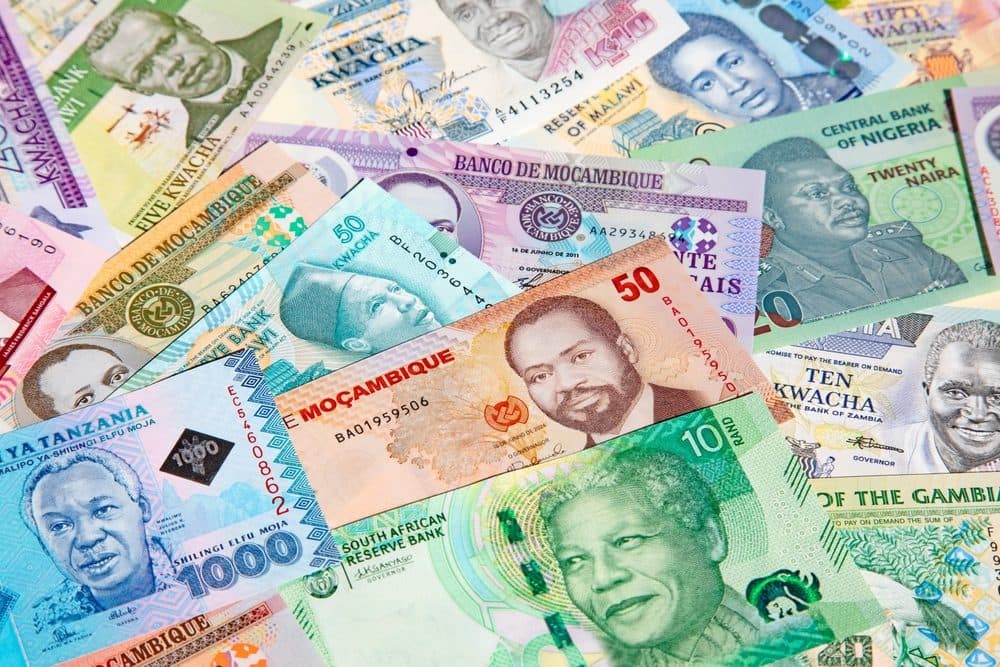

Imagine three people who run the same kind of business in three African cities. Each sells imported phone accessories, and each has just received an invoice from a supplier abroad. They are fictional characters, but what happens to each of them next is built from how their countries' money actually works.
Aya runs her shop in Abidjan, and her supplier asks for €1,000. Aya does not need to check the news to know what that costs her. The CFA franc has been fixed at 655.957 against the euro since 1999, with France standing behind that promise as its guarantor. A €1,000 invoice costs her 655,957 francs today, next month and next year. It is not cheap, but it is predictable.
Tunde runs his shop in Lagos, and for him it is early 2023. His supplier asks for the same €1,000. The rate he sees on the news is not the rate he can get. Nigeria still runs several official exchange windows. His bank may not have the euros he needs, so he is pushed toward a street dealer who charges more. In June 2023, the windows were merged, the naira fell hard, and it has kept falling: from about ₦500 per euro in May 2023 to about ₦1,497 today. The street dealer now charges only about 4% more than the official rate, which is a real improvement. But the same €1,000 costs about three times as many naira as it did before Tunde's story began.
Salma runs her shop in Benghazi, and for her, it is October 2026. Her supplier also wants €1,000. On paper, her currency looks like Aya's. The Libyan dinar is tied to the International Monetary Fund's (IMF) Special Drawing Rights (SDR), a basket of major currencies, and the central bank publishes an official rate of about 7.2 dinars per euro, which is roughly 6.4 dinars per dollar. But the euro on the street costs about 11 dinars, roughly 50-60% more. The central bank cut the dinar's official value by 14.7% in January 2026, and the gap has since opened again. If Salma cannot get euros at the official rate, which would put the order at about 7,200 dinars, she has to turn to the street, where the same order costs about 11,000.

Now compare the labels. Aya's country has a peg. Salma's country has a peg. Tunde's has a float. Yet ask which of the three has the most certainty, and the answer is Aya, while Salma's day looks much more like Tunde's in early 2023 than like Aya's. The word on the label did not decide whose life was predictable.
The label tells you the rule a country says it follows. It does not tell you whether anyone believes the rule, or whether you can get euros at that price. So the question behind this series is: what stands behind the exchange rates African countries maintain, and what happens when the official price of foreign currency drifts away from the price at which people can actually get it?
We came to this question through the African Country Index, the 54-country study we built at Benign and Scribblegreen. One of its five pillars measures economic stability, and many of the strongest scores on it belong to small economies, including several in the CFA franc zone. We wanted to know what was holding those currencies steady, and whether the arrangement worked for the people who depend on it.
This is the first of three articles. Here we answer the first half of the question: who anchors Africa's money, and how did the anchors get there? Part 2 follows the gap between official and real rates through four countries. Part 3 asks what our own index can and cannot tell us.
By the end of this part you will be able to:
explain the difference between a currency, a monetary union, an exchange-rate regime and an anchor;
tell the story of how the pound, the French franc and the rand came to anchor African money;
read the IMF's classification of all 54 African countries, and see why "how many African currencies are pegged?" has two honest answers.
What it means to anchor a currency
Four terms are often used as if they mean the same thing: currency, monetary union, exchange-rate regime and currency anchor. They describe different parts of the system.
A currency is the money itself: Tunde's naira, Aya's CFA franc. A monetary union is a group of countries that share a currency or tie theirs tightly together. Aya's franc is used by eight countries in West Africa, and a second CFA franc is used by six in Central Africa. An exchange-rate regime is the rule a central bank follows about its currency's price: hold it fixed, let it move gently, or leave it to the market. An anchor is the thing that price is tied to.
Here are the three owners again, sorted with those four words.

To anchor a currency is to make a promise about its price. For a promise to work, it needs two things to support it. The first is reserves, the foreign currency a central bank keeps in store so it can sell dollars or euros when people ask for them. The second is convertibility, the real ability of people and businesses to swap their money at the stated rate. Think of a shop that advertises a price but has run out of stock. The price on the sign is still the official price. What you actually pay depends on where you can find the goods.
When reserves or convertibility run short, the same thing happens to money. The official rate stays on the sign, and a parallel market, a street market for foreign currency, opens beside it. The gap between the two prices is the parallel-market premium. Salma's 50-60% is a premium.
Economists call the bargain behind all of this the impossible trinity: a country cannot, at the same time, fix its exchange rate, let money move freely across its borders and run its own independent monetary policy. It has to give one up.
Aya's CFA zone gives up an independent monetary policy because the central bank must defend the euro's exchange rate. Tunde's country, which uses a floating currency, gives up control of its exchange rate to preserve an independent monetary policy. Every arrangement in this series is a different answer to the same trade.
To judge any answer, we will ask four questions of it.
What anchors the rate? It could be the euro, the rand, the dollar, a basket or market forces. The answer determines which external events affect the local currency.
What supports it? A fixed rate requires a credible mechanism to meet foreign-currency demand when pressure builds. Reserves, fiscal policy, monetary policy, and confidence in the authorities all matter, though the extent depends on the system.
Can people actually get foreign currency at that rate? A rate that looks stable but is out of reach for importers, travellers and businesses offers less certainty than its headline suggests. Queues, rationing and parallel-market premiums are the clues.
Who pays when the system comes under pressure? A flexible rate may fall, raising the price of imports. A fixed rate may hold for a time, but may require a tighter policy, require spending reserves, or restrict access to foreign currency. No arrangement removes the cost of adjusting. It changes how the cost shows up and who bears it.
So the choice is never simply between a strong currency and a weak one. Keep the four questions close, because every system we meet will have to answer them. First, though, a little history, because every anchor in Africa was built by someone, for a reason.
The anchors Africa inherited and adapted
African money has a history, and it begins with other people deciding what it would be worth. Three inheritances explain most of Africa's monetary map: the sterling-linked currency boards, the CFA franc zones, and the South African rand area.
The pound and the currency boards
In October 1912, Britain established the West African Currency Board to supply money to the Gold Coast, Nigeria, Sierra Leone and the Gambia. In December 1919, an East African board did the same for Kenya, Uganda and Tanganyika, and Zanzibar joined in 1936. The rule was strict and simple. Local money was issued only when someone paid sterling in London, and it was redeemed for sterling on demand, so an East African shilling was worth exactly one British shilling. In today's language, these were currency boards, which the IMF counts as hard pegs. The pound was the anchor, and the people who used it had no say in its design.
Then independence arrived. As the territories moved toward self-rule, they began issuing their own currencies, and the West African board was dissolved in 1965. Look at how the IMF classifies those territories today. Nigeria, Uganda and Tanzania float. Kenya, Ghana, Gambia, and Sierra Leone are, in practice, pegged to the US dollar. None is a hard peg. The anchor was left with the board.
The franc and the guarantee
France took a different road. The CFA franc was created in December 1945 and tied to the French franc, with France serving as the backstop. In January 1994, the CFA franc was devalued by half, and the Comorian franc by a third. For businesses like Aya's, it was a reminder that whoever guarantees a peg also decides when to move it. In 1999, the euro replaced the French franc as the anchor at an unchanged parity.
Then came the 2019 reform. France stopped appointing representatives to the central bank's governing bodies, except where its guarantee might be called on, and the account the central bank held at the French Treasury was closed. But France stayed the guarantor, and the peg stayed too. Today, the arrangement has two halves: the West African franc and the Central African franc, which share a single parity.
What the arrangement buys is predictability, which is Aya's certainty. What it costs is independence: a central bank that must defend the euro rate cannot set its own monetary policy. And the backing has limits. In Central Africa, reserves covered about 4.3 months of imports at the end of 2025, down from 4.9 months a year earlier, compared with the five months the IMF considers adequate for the union. A guarantee is strong, but it does not make reserves unnecessary.
The rand and the neighbour
In southern Africa, the anchor is not a distant guarantor but a large neighbour. After the South African Reserve Bank was established in 1921, the South African pound was legal tender in South Africa and in the territories that are now Botswana, Lesotho, Namibia, and Eswatini. The rand replaced the pound in 1961. In December 1974, South Africa, Lesotho and Swaziland signed the Rand Monetary Area agreement, and Lesotho and Swaziland issued their own currencies at par with the rand. Botswana opted out of the system and introduced the pula in 1976 to pursue an independent monetary policy. The Common Monetary Area replaced the old agreement in 1986, and Namibia joined in 1992 once it was independent, issuing the Namibian dollar in 1993.
Today, Lesotho, Namibia, and Eswatini issue their own money at a 1:1 rate with the rand, and those issues are backed by rand assets. South Africa accounts for more than 90% of the area's output, so the smaller economies follow its lead on monetary policy. That is a different bargain from the CFA franc. There is no common central bank or pool of reserves, and no foreign guarantor. Botswana, the neighbour that left, is now the only crawling peg in Africa, tied to a basket.
The smaller bargains
Others struck their own deals. Cabo Verde, Comoros and São Tomé and Príncipe tie their currencies to the euro. Djibouti runs a currency board against the dollar. Libya's dinar is tied to the SDR. Morocco manages the dirham within a band around a basket of currencies. Each is a different bargain with a different partner.

Put the three main stories side by side, and a pattern appears. Where the old arrangement kept a guarantor in the room, as France did, or a dominant neighbour, as South Africa did, the anchor survived. Where it was a distant board that was simply wound up, countries built their own systems, and those systems vary widely today. That is a reading of the history, not a law. But the lesson is clear: an institutional choice can provide predictability, but it also determines which economic pressures a country must absorb and how much room its policymakers have to respond on their own.
The dates at a glance
1912: the West African Currency Board begins (the East African board follows in 1919)
1921: the South African Reserve Bank opens
1945: the CFA franc is created
1961: the rand replaces the South African pound
1965: the West African board is dissolved
1974: the Rand Monetary Area agreement
1976: Botswana leaves and introduces the pula
1986: the Common Monetary Area begins
1992 and 1993: Namibia joins, then issues the Namibian dollar
1994: the CFA franc is devalued by half
1999: the euro replaces the French franc as the CFA anchor
2019: the CFA governance reform
How Africa's currencies are sorted
To compare 54 countries, we will use the classification the IMF already maintains. Since 2009, it has sorted every member's exchange-rate arrangement into four types and ten categories, replacing an older list of eight. It also sorts by what a country does, not by what it announces, so the IMF's label can differ from the government's.
A way to picture the four types is a boat's anchor chain. The shorter and stiffer the chain, the less the boat moves.
Hard pegs: the chain is welded to the seabed. The country gives up its own currency, or ties it so tightly by law that the central bank cannot create money freely. This covers using another country's money and the currency board, where the law commits the country to swap local money for a foreign currency at a fixed rate. Only one African currency sits here: Djibouti's, tied to the US dollar.
Soft pegs: ropes of different lengths. The currency is held close to an anchor, with more give than a hard peg. Five categories belong here:
A conventional peg is formally fixed against another currency or a basket. Aya's CFA franc is one, and so are the rand-linked currencies of Namibia, Lesotho and Eswatini, and Libya's dinar.
A peg within a band allows the rate to move within a margin around a central rate. Morocco is the African example.
A crawling peg moves the central rate in small steps along a set path. Botswana is the only one.
A stabilised arrangement keeps the market rate within a 2% margin for six months or more without being a float. Algeria, Mozambique and Sudan are examples.
A crawl-like arrangement keeps the rate within 2% of a statistically identified trend for at least 6 months. Kenya, Ghana, Rwanda and Tunisia are examples.
Floating regimes: the rope is cut. The market largely sets the rate, with no predictable path. The IMF distinguishes between floating (Nigeria, South Africa, Egypt) and free-floating, where intervention is rare (Somalia).
Other managed arrangements: no single rule. A residual box for systems that fit none of the above, such as Ethiopia, DR Congo, Zimbabwe and South Sudan.
You will often hear another label, the "managed float", for a currency the market moves while the central bank leans against it. In practice, what people call a managed float roughly corresponds to the stabilised, crawl-like and other managed boxes.
Cutting across these types are the monetary unions: the West African franc zone (eight countries), the Central African franc zone (six) and the Common Monetary Area built around the South African rand (four, counting South Africa itself). A union is about who shares the money. A type is about how the rate is managed. The two can be read together, as the table below does.
All 54 countries on one table

The question behind the map
Return to Aya, Tunde and Salma. Aya can calculate her euro invoice using a fixed parity. Tunde has to account for market movements and for the conditions under which his business can get foreign exchange. Salma lives under a formal peg, but the IMF's assessments show that Libya's official rate has not always reflected the price at which foreign currency is available in the parallel market.
The difference is not simply that one currency is fixed and another floats. It is the relationship between the rule, the institutions that support it and the experience of the people who need to use it.
That is why a map of African exchange-rate arrangements is useful for showing which countries peg, float or manage their currencies. It cannot tell us whether a business can obtain the dollars it needs, whether a student can pay fees abroad, or who carries the cost when the system comes under pressure.

Three things that stand out
First, "how many are pegged?" has two honest answers. Only one African currency is on a hard peg, and 38 are on soft pegs. Strictly, 23 are currency boards or conventional pegs. Count every soft peg, and 39 of the 54 are pegged in some sense, while 11 float and 4 sit in the residual box. The number you hear depends on how generous the speaker is with the word.
Second, the anchors are not who you might expect. The euro anchors 18 African currencies, and the dollar 15, and most of the dollar group are not announced pegs at all: 13 of the 15 are stabilised or crawl-like in practice. The euro's grip is written into law. The dollar's grip is mostly behavioural.
Third, labels move. Egypt was crawling in the IMF's 2025 table and floating in the 2026 one. Ethiopia's July 2024 reform did not make it a floater, because the IMF lists it as other managed. Kenya and Ghana are listed by the IMF as crawl-like, which makes them soft pegs against the dollar in practice.
What to take away from Part 1
A currency, a monetary union, a regime and an anchor are four different things.
An anchor is a promise about a price, and the promise needs reserves and convertibility behind it.
Africa's anchors have three main inheritances: the pound's currency boards, the French franc and its guarantee, and the rand and its dominant neighbour.
The IMF sorts all 54 countries by their activities. Only one is a hard peg, 23 are pegged in the strict sense, and 39 are pegged in the broad sense.
A label tells you the rule. It does not tell you whether the rule holds.
Next in the series. Part 2 follows the gap between the official price of a dollar and the price people can actually pay, through Egypt, Nigeria, Ethiopia and Libya.

The African Country Index 2026 is an independent, 54-market research project developed by Ariyo Oluwaseun BATi and the team at Benign and Scribble Green, which scores African economies on economic strength, stability, trade performance, global reputation, and market potential. The published report draws on data from the IMF, the World Bank, the United Nations, UNCTAD, UN Tourism, and ITC trade sources, among others. It is a comparative screening tool, not a forecast of investment returns, and is not a substitute for country-, sector-, or transaction-level due diligence. The full report is available to download here: bit.ly/ACI2026Report.
